We have performed quantum mechanical probability current calculations through a simple two dimensional (2D) jellium potential modeling the STM tip - nanotube - support system. STM constant current feedback loop was simulated by moving the tip along a line (''quantum line cut'' ) where the transferred probability was constant.
The 2D model potential has
the value zero outside the effective surfaces
of the electrodes and the value ![]() inside.
(
inside.
(![]() ,
, ![]() ).
).
Tunneling probability is calculated from time dependent
scattering of a Gaussian wave packet approaching the model
potential from the bulk of the tip.
The ![]() probability current density was calculated along a horizontal
line inside the support bulk (at
probability current density was calculated along a horizontal
line inside the support bulk (at ![]() ).
Line integration of
).
Line integration of ![]() along this line gives the
I(t) probability current and the tunneling probability is
obtained as
along this line gives the
I(t) probability current and the tunneling probability is
obtained as ![]() .
.
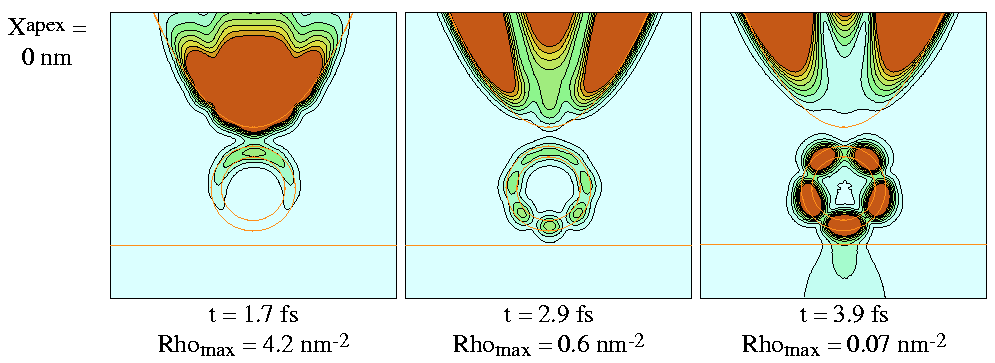
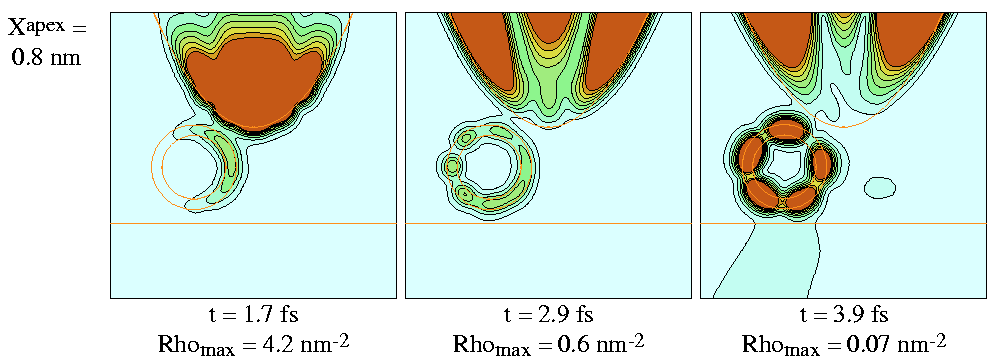
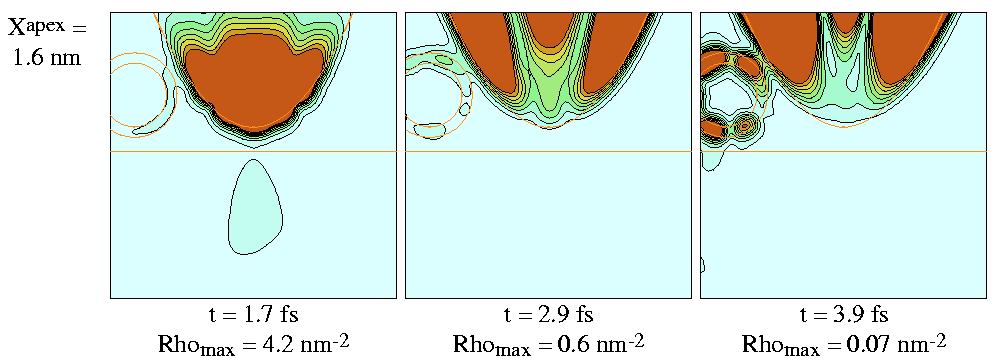
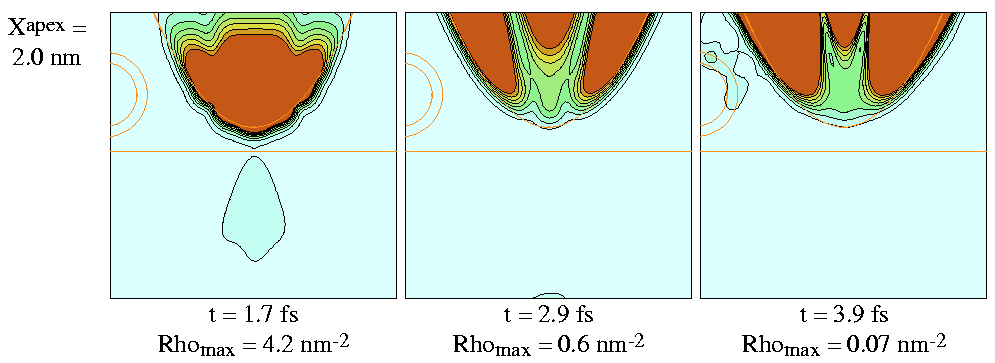
Probability density of the scattered wave packet is shown on
Fig. 6..


Figure 6:
Probability density of scattered wave packet for
selected time instants and for selected Xapex lateral
tip displacements.
Effective surfaces of electrodes are shown by red lines.
Size of presentation window is
![]() .
Contour lines are drawn on sqare root scale.
Each frame is normalized to its maximum density.
Initial momentum of Gaussian wave packet is
.
Contour lines are drawn on sqare root scale.
Each frame is normalized to its maximum density.
Initial momentum of Gaussian wave packet is
![]() and its initial with is
and its initial with is
![]() .
.
| Xapex (nm) | Forbidden | Tube | Total Interface = Forbidden + Tube |
| 0.0 | 0.071 | 0.084 | 0.155 |
| 0.8 | 0.079 | 0.123 | 0.202 |
| 1.6 | 0.060 | 0.020 | 0.080 |
| 2.0 | 0.057 | 0.0001 | 0.057 |

Figure 7:
Comparison of geometric and quantum line cut.
Thick red line is the geometric line cut.
Crosses show calculated points of quantum line cut.