MTA KFKI - Research Institute for Technical Physics and Materials Science,
H-1525 Budapest, P.O.Box 49, HUNGARY
E-mail: mark@sunserv.kfki.hu
NATO Advanced
Study Institute, Nanophase Materials: Synthesis - Processes - Applications,
June 20 - July 2, 1993, Corfu, Greece, poster.
NATO ASI Series:
Nanophase Materials 205-208 (eds: G. C. Hadjipanayis & R. W. Siegel), 1994
Kluwer Academic Publishers
PACS numbers: 73.40, 61.16, 68.35
In the present paper a possible explanation of "abnormal" STM images
of Highly Oriented Pyrolythic Graphite (HOPG) is proposed. The
interpretation of several images taken at our laboratory in atmospheric
conditions, and at room temperature (for the experimental details cf. the
subsequent section) containing tip changes, left-right asymmetry (cf.
fig.1) is based on the work of Mizes et al [5].
Undesired, so called "tip changes" are frequently observed, i.e.
drastic changes of the image appear during its acquisition. This may be
considered as a consequence of the modified structure of the microtip
i.e. modifications are caused in the tip cluster configuration or orientation.
Once this hypothesis is accepted, a new method to investigate the structure of
the STM tip cluster may be proposed. A great amount of work has been carried
out on HOPG, its structure and its behaviour during STM investigation are
well-known. From the modifications of the acquired image during imaging HOPG
the modifications of the tip structure may be inferred.
An oscillation between two metastable states of the tip cluster was observed
for about 6 minutes (cf. fig 3) after which the image structure
characteristic for the upper parts is found again, and no more negative images
were observed.
In fig.4 (first image pair from fig.3, 50x50 A2) a
tip change is shown where before the change the upper regions of the
left and right image are identical and the atomic details are poorly resolved.
After the tip change an improved resolution is found and the left and right
images are negative to each other.
The results are shown in fig.5. The unit cell averages show more
clearly that LU is coincident with RU and RL is the negative of LL. This
statement is also supported by the line cuts shown in fig 6. Inverted
images of HOPG are frequently observed when using Pt tips. This image structure
may exist for several tens of minutes. In ref [6] investigations of Pt clusters
of 1-4 atoms on HOPG is reported. The authors conclude that the interaction of
Pt atoms with HOPG is strong enough to allow the clusters to be imaged.
Examine the calculated tunnel current intensities from ref [1] for
clusters W10[111] and a W9[111] scanned
over HOPG. Line cuts in the "normal" directions, i.e. those joining a maximum
with one of its closest neighbours ("short cut") show only a little
difference. As seen in fig. 12a for short cuts the ratio of Half
Width at Half Maximum (HWHM) to Maximum Height (MH) differ only
slightly. Here A, and B stand for a and [beta] sites of HOPG. Due to the fact
that the experimental data may contain noise, although the maxima are located
once over a site A, in the other case over a site B, these two tip structures
can hardly be distinguished.
2. H.-W. Fink, IBM J. Res. Develop. 30 (1986) 460
3. B. Schleicher. Th. Jung, H. Hug, H. Burtscher, Z. Physs. D.,19
(1991) 327
4. J. Garnaes, E. Kragh, K. A. Morch, A.R. Thölén, J. Vac. Sci.
Technol. A, 8 (1990)
5. H. A. Mizes, Sang-il Park, W.A. Harison, Phys. Rev. B, 36 (1987)
4491
6. U. Müller, K. Sattler, J. Xhie, N. Venkatesvaran, G. Raina, Z. Phys. D,
19 (1991) 319
7. G. M. Shedd, P. E Russel, Surf. Sci. 266 (1992) 259
http://www.mfa.kfki.hu/int/nano/preprint/corfu1993.pdf
Abstract
A method based on the detailed analysis of tip changes is proposed for the
investigation of tip cluster structure. As proposed by Mizes et al [7] the
tunneling current for a multiple tip is considered to be produced by the
superposition of currents corresponding to the individual tip atoms. Good
agreement is found between experimental results for PtIr tips and computer
simulations for a Pt15 [110] tip cluster. From the modification of the acquired
image during imaging HOPG the modifications of the tip structure may be
inferred.
Keywords
STM, image formation, tip
Introduction
Scanning Tunneling Microscopy (STM) is considered as a suitable
method for investigating clusters. Nevertheless the acquisition of good images
depends severely on the properties of the microtip, a cluster of 10-15 atoms
[1]. All the conventional methods except the STM, High Resolution Transmission
Electron Microscopy (HRTEM), and Field Ion Microscopy (FIM) [2] are not apt to
give information on one single cluster but only on a statistical average over a
great number of aggregates. Examining clusters deposited on a substrate by STM
[3] or imaging an STM tip with an other one has some uncertainties [4].
Whenever the slope of a given feature on the sample exceeds that of the apex of
the tip, the role of the tip and sample will be interchanged, hence regions of
the tip will be imaged. This is due to the fact that the STM image is a
convolution of the tip and sample structures.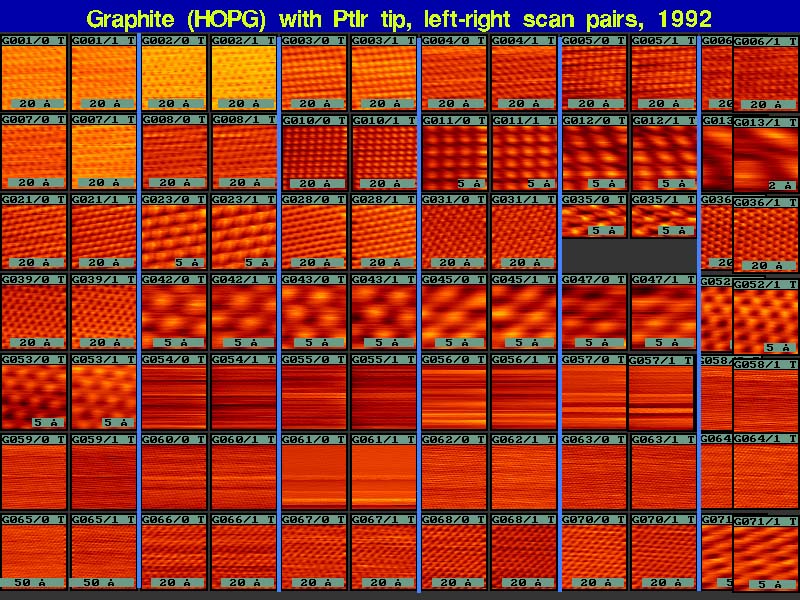
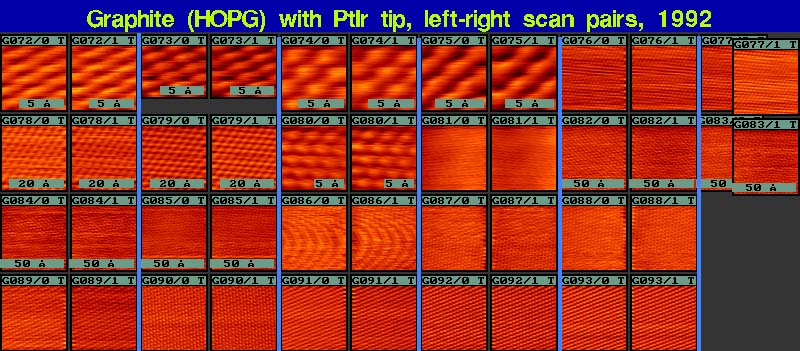
Fig 1., 2. HOPG STM images
In this paper it is
pointed out that the surface of HOPG has a threefold symmetry and although
different images have been seen over the same area of graphite, the variety of
images cannot be due to different surface properties of graphite. Our proposed
method based on the assumption of Mizes et al [5], that an image given by a two
atom tip may be considered as a superposition of two shifted images makes
possible to draw conclusions concerning modifications of the tip structure.Experiment
A mechanically sharpened PtIr STM tip was scanned in air at room
temperature over HOPG. Constant current topographs were recorded when applying
tunneling currents in the range of 1 nA at a bias of 100 mV, at a
scan speed of 986 A/sec (the scan speed does not have a marked influence
on the image structure).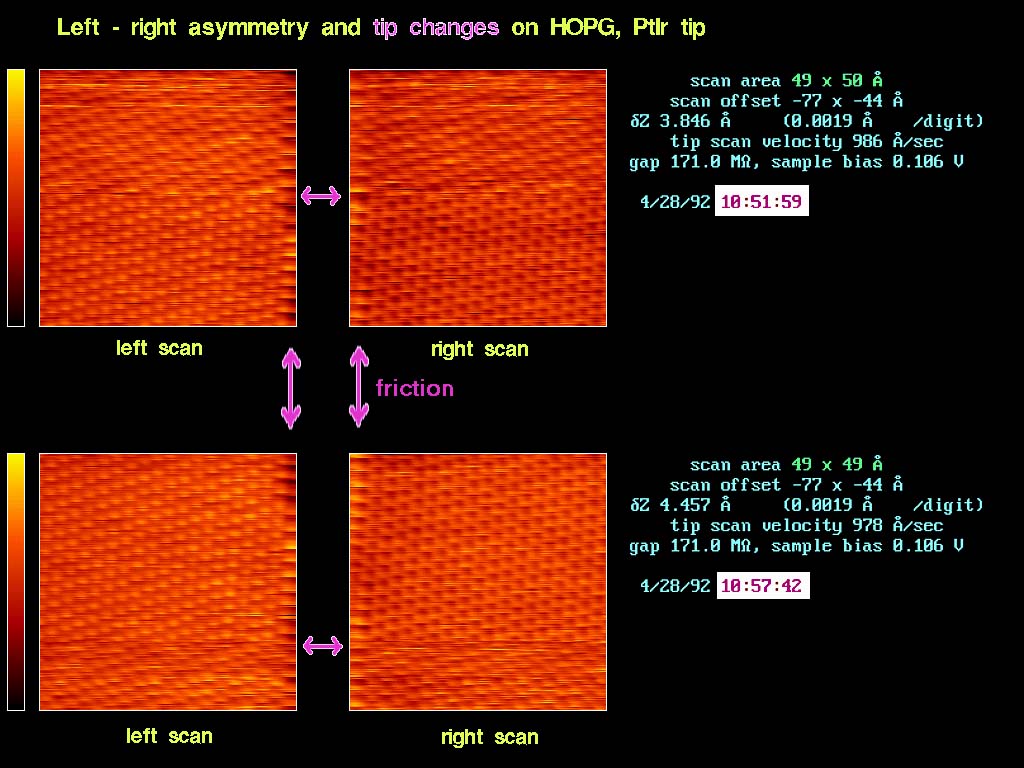
Fig 3. Two scans recorded with 6 minutes difference.
The left and right images correspond to left and right scan directions.
It should be emphasized that in several cases similar differences between the
left and right images have been received, the image in fig.3 is only one
example of our results (cf. fig.1 and 2). 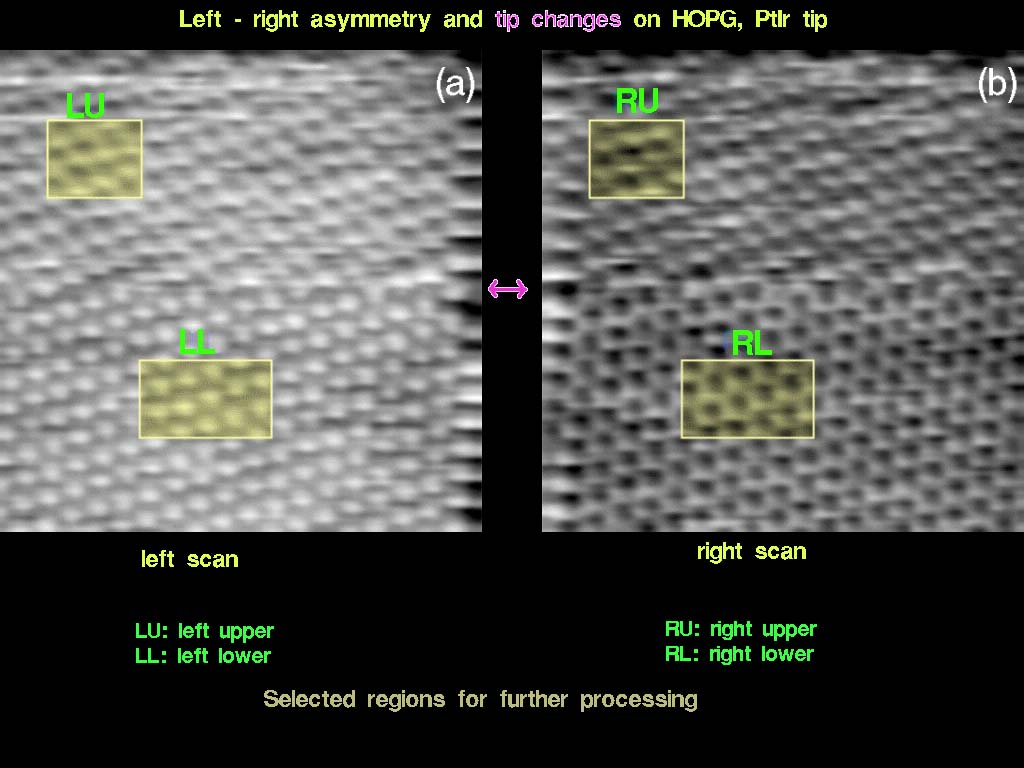
Fig 4. First scan of fig.3 with regions selected for
further processing highligted.
The exact location of the tip change was determined using autocorrelation
technique. The two images were separated into four parts: left upper
(LU), left lower (LL), right upper (RU) and right lower
(RL) ones. For each of these four images unit cell averaging was done.
Fig 5. Processed selected regions of fig.4
Fig 6. Line cuts on fig.5.
Note, that in the images of the type of LU and RU the lattices of the maxima
and of the minima have an identical symmetry to that of HOPG, but they are
shifted with respect to each other. Hence the global structure does not have
the symmetry of normal HOPG. Consequently a minimum has four maxima in its
neighbourhood instead of only three as in a normal HOPG picture. Theory
A possible explanation of the measured images may be based on the model
calculations carried out by Tsukada, et al [1].
Fig 12. Line cuts from the theoretical STM images of Ref.1
In fig. 12b the line cuts on the basis of the same calculations are
shown in a direction joining a maximum with its neighbour from the second
sphere of coordination ("long cut"). Here the difference between the two
image structures is more clear. These observations led the authors to the
conclusion that for evaluation of images the knowledge of the structure of long
cuts is necessary, too.Simulation
The right hand side of fig. 4a and the left hand side of fig.4b
show that there is a strong interaction between the tip and the sample i.e.
when changing course, the tip has to suffer an increased friction. This may
lead us to the explanation of the observed phenomena. We assume that at
the points where the tip is turned due to the strong friction of adhesive
nature the tip cluster orientation is changed.
Fig 8. Pt15[110] cluster cutted from Pt (FCC) crystal structure
Let's assume the active microtip to be a Pt cluster oriented along the
[110] direction with a one atom apex (cf. fig. 8). It is built up
of 16 atoms. If the apex atom is removed a Pt15 cluster is
formed with a plane of four identical atoms at the corners of a rectangle which
has the dimensions of a and a/Sqrt[2], where a=3.9158
Å is the lattice constant of Pt. This means that
a/Sqrt[2]=2.7688 Å, close to the value of 2.46 Å
which is the distance of the B sites in HOPG. If one uses a model considering
each tip atom as an individual microtip and the global image as a result of the
superposition of the four individual images, normal and abnormal HOPG images
may be produced as a function of the rotation of the Pt [110] plane
relative to the graphite lattice.
Fig 7. Crystal structure of HOPG
Fig 9. Scanning of the Pt15[110] cluster above HOPG plane
In order to reproduce the experimentally observed images, we used a "normal"
HOPG image, i.e. similar to that calculated in ref [1] for a single atom tip.
This was simulated using the superposition of three plane waves with
propagation vectors at angles 1200 as used in ref [5,7]. It was
found that the structure calculated in [1] is well reproduced by a combination
[ cos x, cos x, (sin x+cos x) / Sqrt[2] ]. The four atom Pt
[110] plane, and the simulated normal HOPG image were Fourier transformed
and convoluted in a way shown in fig.10. The images obtained from the
Fourier transforms of the products for different angles of rotations of the
Pt Fourier transform with respect to the HOPG Fourier transform are
shown in fig.11. These images are in good agreement with the
experimental images.
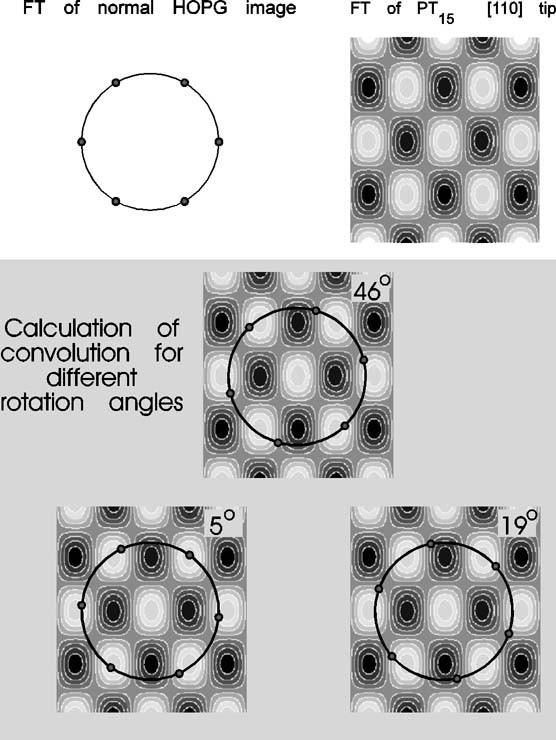
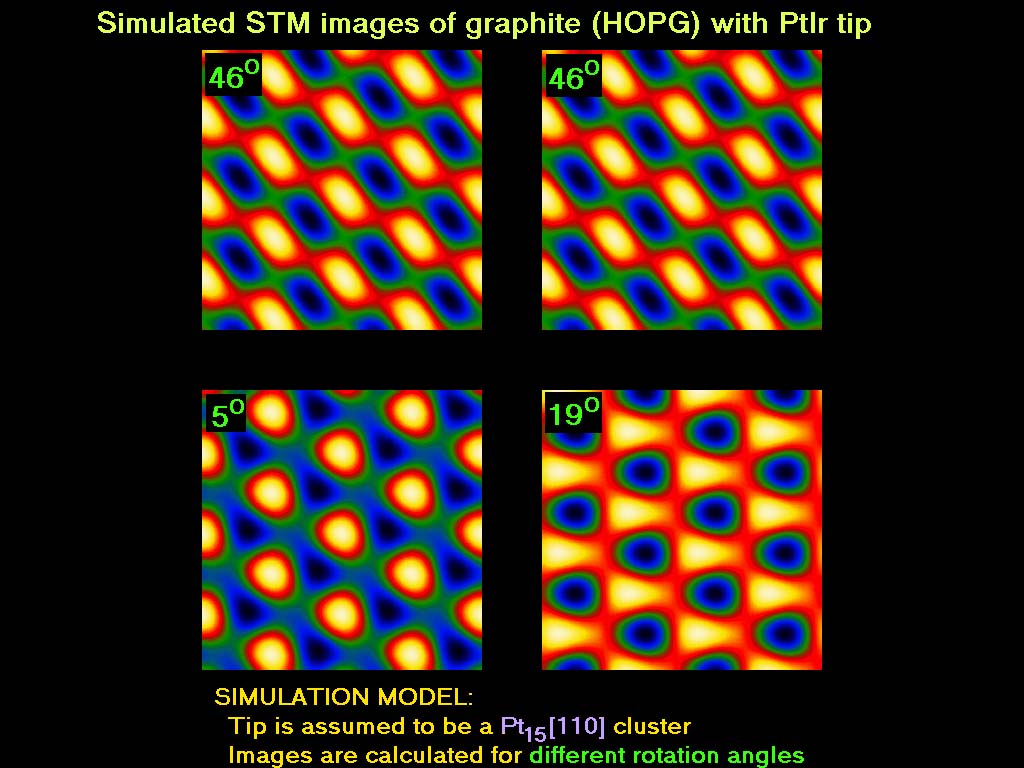
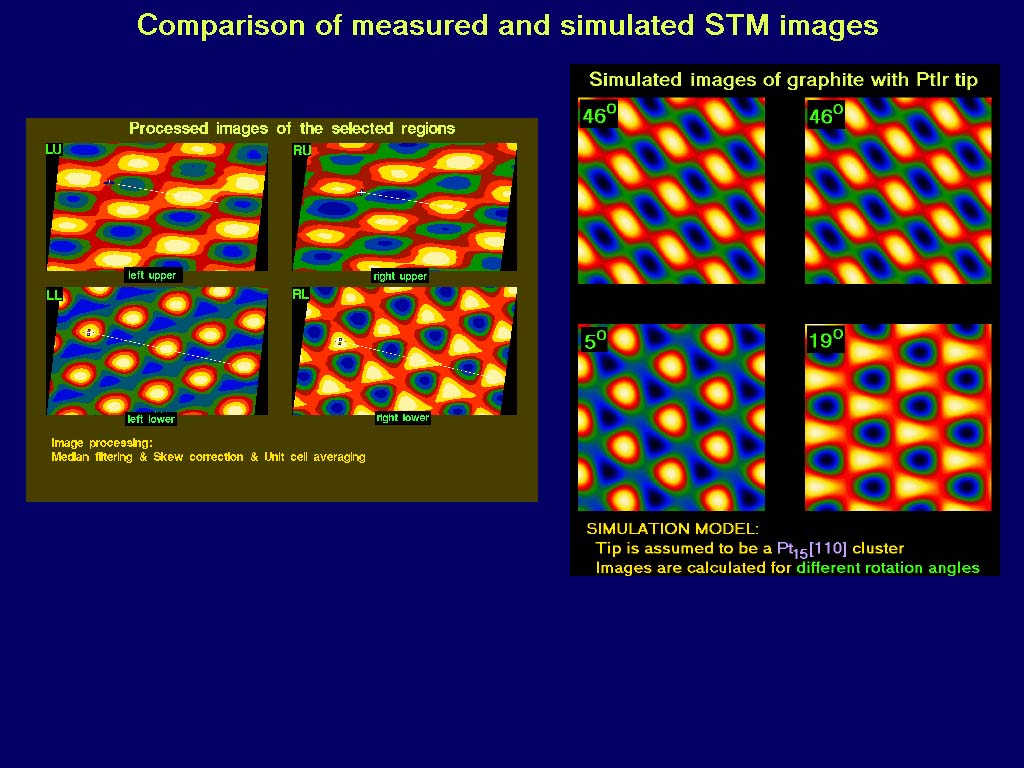
Fig 10. Calculation of simulated images in Fourier space
Fig 11. Simulated STM images
Fig 13. Comparison of measured and simulated STM images
All the images were generated using the same wave combination, the only
difference is the angle of rotation of the Pt plane. The LU-RU type structure
is generated at a rotation angle of 460, the negative image (RL) at
190 and the nearly normal image (LL) at 50.Conclusion
Taking into consideration the additional information furnished by the
observed tip changes and the structure of line cuts drawn in a non conventional
direction, we succeeded to overcome the difficulty mentioned by Mizes, et al.
[5]. The detailed investigation of formerly neglected tip changes allows us to
make assumptions concerning the tip structure and changes in it during the
scan. More sophisticated investigation of tip changes may lead to a better
understanding of the tip structure.References
1. M. Tsukada, K. Kobayashi, N. Isshiki, H. Kageshima, Surf. Sci. Rep.
13 (1991) 265
Last updated: Oct 3, 2002
by Géza I. Márk , mark@sunserv.kfki.hu
This page was accessed times
since Oct 3, 2002.