Calculation of Tunnel Current Along Semiclassical Trajectories for STM
E. Balázs, Department of Physics, Gy. Papp, Department of Atomic Physics, G. Márk, Quantum Theory Group
Institute of Physics, Technical University, H-1521 Budapest, Hungary
Corresponding author: G. I. Márk, mark@sunserv.kfki.hu , Nanostructures Laboratory , MFA Research Institute for Technical Physics and Materials Science
H-1525 Budapest, P.O.Box.49., Hungary
Our other publications on STM simulation are available here.
ABSTRACT
The dependence of tunnel current on geometric parameters (rotational hyperboloid shaped tip, plane anode) is studied. The transition probability through a phenomeno-logical potential barrier is calculated along semiclassical trajectories in plane wave ap-proximation. The current is obtained as a sum of suitably weighted current densities calculated from the above defined transitional probability.INTRODUCTION
The recent development of the scanning tunneling microscopy (STM) has stimulated renewed interest in the problem of a particle tunneling through a potential barrier.The exact quantummechanical solution of the tunneling problem of STM involves several principal, and technical difficulties. However, the main tendencies furnished by experiments may be qualitatively understood also on the basis of simple models. In the present paper the authors propose a semiclassical model for the interpretation of the high lateral resolution of the STM.
MODEL
The geometry of the tip-surface arrangement is approximated by a rotational hy-perboloid and a plane. By this choice the electrostatic equipotential surfaces and lines of force due to the applied bias and contact potential are well known from classical electrodynamics.The electrons are assumed to tunnel along semiclassical trajectories determined within the frame work of the WKB approximation.
The tunneling of an electron along the trajectory is then considered to be equivalent to the tunneling between two infinite plane electrodes being at a distance equal to the arc length of the trajectory measured from the cathode to the anode. (Thus the 2D problem is approximated by a 1D one, and the difficulties due to the unknown boundary conditions referring to the wave function of the electron in the tip may be avoided.) The potential seen by an electron when tunneling from one electrode to the other is approximated as
V(s) = Velst(s) + Vxc(s) + Vim(s) + Voc(s)
where s is the arch length of a semiclassical WKB trajectory measured from the cathode to the actual position of the electron, Velst(s) is the electrostatic potential due to the electron density and for the exchange correlation potential the usual Wigner-formula is used. The image potential is calculated as an infinite sum. The potential Voc(s) arises from the external bias and the contact potential. The potential barrier approximated in this way aligns with that obtained in a quasi-SCF way1.
DETERMINATION of the TRAJECTORIES
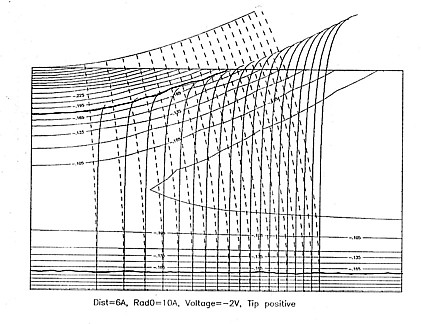
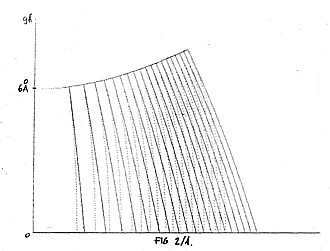
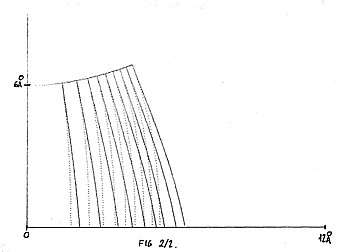
The model calculation was carried out for W (EF = 8.0 eV, Phi = 5.0 eV) , and Au (EF = 5.5 eV, Phi = 4.3 eV) as tip, and sample, respectively. When determining the WKB trajectories numerically, the starting points were chosen along the circumference of the hyperboloid (plane) corresponding to the tip negative (tip positive) case. As it is shown in Fig. l the WKB method breaks down (as it should do) at the boundary of the forbidden region. Obviously the particle enters the forbidden region orthogonally in both cases, since in the classically allowed region it follows the classical trajectory which near to the electrode coincides with the lines of forces (see Fig. 2).
Thus, in tip negative case the semiclassical trajectories were approximated by lines of force of the electrostatic field, as proposed in [2]. For tip positive biases straight lines perpendicular to the plane were chosen as trajectories on the basis of Fig.2.
RESULTS
Several calculations were carried out for different biases and geometrical parameters (radius of curvature of the tip, distance of the electrodes) for tip negative as well as for tip positive cases.
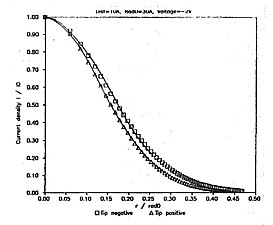
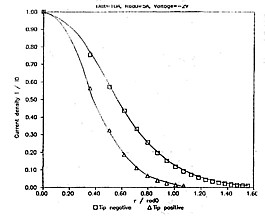
The overall tendencies of the variation of current with the distance obtained ex-perimentally (eg. [3]) are in good agreement with our results. It is also interesting to observe that in all cases the it tip negative current is higher than the tip positive one, when all the other parameters are kept constant. The high lateral resolu-tion of the STM is also well demonstrated in Figs.3, and 4, where the current density as a function of the radial variable measured from the symmetry axis of the arrangement is displayed. However, our model does not support the plane-plane approximation for blunt tips (R > 30A) , i.e. neither in this case the electrodes may be considered as infinite planes.
When comparing our resolution with the results obtained by Das and Mahanty4, it turns out that, probably due to the assumed different potential barriers, our resolution is worth than their, but it is in good agreement with the results obtained by Garica, et al.5. The weak distance dependence of the resolution is also manifested by our results. The prediction of our model concerning the difference of lateral resolution in tip negative and tip positive cases should be checked by experiments.
REFERENCES
- L. Orosz and E. Balázs, Surface Sci. 177(1986)444.
- J. László and E. Balázs, 10th Werner Brandt Workshop, Alicante 1987.
- G. Binnig and H. Rohrer, Helvetica Phys. Acta 55(1982)726.
- B. Das and J. Mahanty, Phys.Rev B 36(1987)898.
- N. Garcia, C. Ocal and F. Flores, Phys.Rev.Letters
50(1983)2002.
Last updated: Jan 31, 2004 by Géza I. Márk , mark@sunserv.kfki.hu
This page was accessed
